When you pull a sample from the lean clays along the Arkansas River or the silty fills in midtown Tulsa, you can feel the plasticity just by working it in your hand. That field impression can be misleading though, and that's exactly why we run Atterberg limits under ASTM D4318. The liquid limit and plastic limit give you numbers you can actually use, numbers that tell you whether that material will swell after a wet spring, shrink during a dry August, or lose strength under repeated loading. In a city where the summer heat pushes soil moisture to the extremes, skipping this test is a gamble that no geotechnical engineer should take.
We routinely combine Atterberg limits with a standard grain-size analysis on the same sample, because the plasticity index alone doesn't complete the picture; you need the fines content and the sand fraction to classify the soil correctly under the Unified Soil Classification System. That dual approach has saved more than one Tulsa project from the misclassification that happens when someone relies on visual-manual methods alone.
A plasticity index above 20 in Tulsa's lean clays is a loud signal: expect swelling potential and design your footings deeper than the active zone.
Methodology and scope
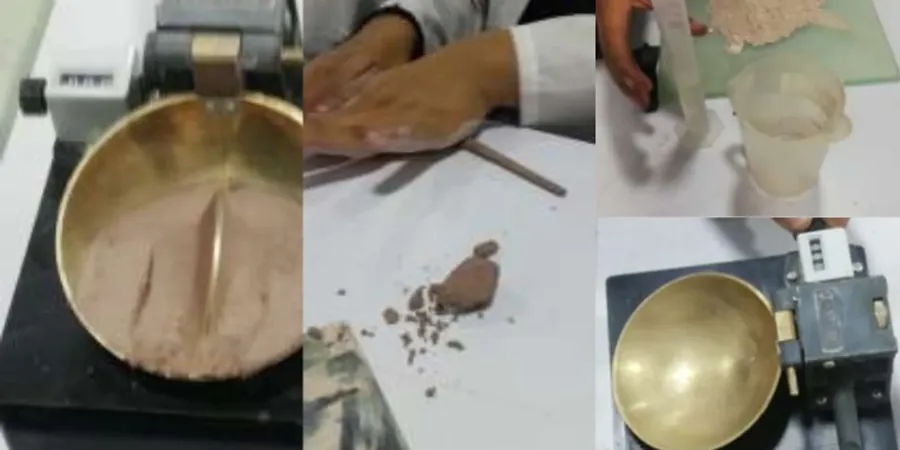
The real value shows up when you plot the results on a plasticity chart. A liquid limit of 45 and a plasticity index of 22 puts you in the CL zone, but if that same soil plots near the A-line, the behavior under load changes significantly. We've seen samples from the Dawson series soils in eastern Tulsa County come back with liquid limits above 50 and plasticity indices over 25, which flags potential volume change issues that a standard bearing capacity calculation won't catch. The Casagrande cup method, paired with the fall cone when requested, gives repeatable results that hold up during peer review.
Local considerations
The collapsible silts and expansive clays found across the Arkansas River floodplain and terrace deposits make Atterberg limits non-negotiable in Tulsa. The city sits on a mix of Pennsylvanian shale residuum, Quaternary alluvium, and pockets of windblown silt, and each behaves differently when the moisture content swings. A soil with a plasticity index of 30 will push against a basement wall with far more force than a PI of 10, and that difference translates directly into structural distress if it is not accounted for in the design.
The IBC references ASTM D4318 results when classifying expansive soils, and Chapter 18 of the building code ties the plasticity index directly to foundation depth requirements. In eastern Tulsa County, where the Dawson and Dennis soil series dominate, we frequently see liquid limits exceeding 50 and plasticity indices above 25, which places these materials in the CH category. That classification triggers specific prescriptive measures under the IRC and IBC, including deepened footings, moisture barriers, and in some cases, chemical stabilization. Without the Atterberg numbers, a designer is guessing, and the cost of that guess shows up years later as cracked slabs and bowed retaining walls.
Explanatory video
Applicable standards
ASTM D4318-17e1, ASTM D2487-17, AASHTO T 89, AASHTO T 90, IBC Chapter 18 (Expansive Soils)
Associated technical services
Liquid and Plastic Limit Determination
Full ASTM D4318 procedure with multi-point liquid limit, plastic limit by thread rolling, and calculated plasticity index. Includes moisture content determination and USCS classification per ASTM D2487.
Shrinkage Limit and Linear Shrinkage
Shrinkage limit testing using the mercury displacement method, plus linear shrinkage bar tests for road subgrade materials where volume change potential affects pavement performance.
Soil Activity and Swell Potential Assessment
Combined Atterberg limits and hydrometer analysis to calculate soil activity (PI / clay fraction), correlated with published swell potential charts to guide foundation depth and moisture control recommendations.
Typical parameters
Frequently asked questions
How much do Atterberg limits tests cost in Tulsa?
A standard liquid limit and plastic limit determination with plasticity index calculation runs between US$50 and US$90 per sample, depending on the number of points run for the flow curve and whether the sample requires extensive preparation due to high organic content or gypsum. Shrinkage limit testing adds a modest increment. We provide firm quotes based on the sample condition and the turnaround time required.
How long does it take to get Atterberg limits results back?
Standard turnaround is 3 to 5 business days from sample receipt. This includes oven-drying, pulverizing, wet sieving through the No. 40, and running the full multi-point liquid limit with the plastic limit thread rolling. Expedited 24-hour service is available for urgent construction support, though the drying time for wet samples sets a hard floor on turnaround.
Why are Atterberg limits important for Tulsa's expansive soils?
Tulsa sits on the Dawson and Dennis soil series across much of the county, both of which are known for high plasticity clays with liquid limits above 50 and plasticity indices over 25. These soils swell when wet and shrink when dry, generating enough lateral and vertical pressure to crack slabs, bow basement walls, and shift shallow footings. The Atterberg limits classify the soil under USCS and trigger the IBC expansive soil provisions that dictate foundation depth and moisture control measures.
What's the difference between the Casagrande cup and the fall cone method?
The Casagrande cup method, which is the ASTM D4318 standard, determines liquid limit by counting the number of blows required to close a standard groove under controlled drop conditions. The fall cone method, more common in European practice, measures the penetration depth of a standardized cone into a soil paste. Both yield comparable liquid limit values for most soils, but the Casagrande cup is the reference method in US practice and the one we use for all ASTM-compliant reporting. We can run the fall cone on request for projects following Eurocode 7 or for research comparisons.